
Group reporting
Changed account mapping: keep group figures comparable
Sumledger · October 28, 2026
Moving an account to a different report line can change how the group's performance looks without changing its operations. Here is a practical way to document the change, check historical figures and explain the difference to management.

Moving an account to a different report line can change how the group’s performance looks without changing its operations. Here is a practical way to document the change, check historical figures and explain the difference to management.
What happens when account mapping changes?
Account mapping connects local ledger accounts to the group’s shared reporting structure. Changing that connection can move amounts between report lines while the source accounts remain unchanged. To keep group figures comparable, the finance team must separate the effect of new mapping from changes in operations and other adjustments.
That sounds straightforward. Yet the change is often treated as technical maintenance: an account moves, the report runs again, and a previous month shows a different figure. Only in the management meeting does someone notice that last month’s commentary no longer fits.
The new mapping is not necessarily wrong. The problem is that two valid reports may use different definitions. This guide concerns internal management reporting. Requirements for statutory reporting and any restatement of comparative figures need separate consideration.
A scenario: the same cost on a new report line
Almvik Holding is a fictional demo group with eight entities in three countries and five ERP and accounting systems. Suppose its Group Controller discovers that a local account for group services maps to different report lines in two entities.
The controller wants to bring the cost under a common definition. That makes sense, but the CFO also needs to explain the movement against the previous month. If only the current period uses the new mapping, one cost category may appear to rise while another falls. If historical figures are recalculated without being labelled, they no longer match the report already delivered to the board.
Before making the change, the team therefore needs two decisions: what the new report line should mean, and how earlier periods should be presented. This example describes a working method, not a customer or a claim about a particular system’s capabilities.
Define exactly what changes
The change description should identify the local account, entity, old report line, new report line, reason and first period covered by the new definition. Include any dimensions or additional accounts involved in the rule. An account number alone does not always identify equivalent economic content across systems.
Also record what stays unchanged. Is this only a reclassification in the group report, or does the local ledger need a correcting entry? Should group adjustments or eliminations be affected? Keep these actions separate. A presentation change does not automatically justify a new journal entry.
Build a bridge between the old and new reports
Test the mapping change by calculating the old and new reports on the same basis. Use the same entities, period, source data and currency assumptions. Exclude other changes from the test. Otherwise, you cannot tell whether the difference comes from mapping or from additional vouchers posted between runs.
A simple change bridge is:
Report under old mapping + isolated mapping effect = report under new mapping.
This is a reconciliation model, not an accounting rule. If an amount simply moves between two cost lines within the same subtotal, that subtotal should remain unchanged. If it changes, investigate whether an account has been omitted, counted twice or moved across the subtotal boundary.
Show the bridge for the affected report lines. A total-level explanation can hide errors that offset each other. Retain the connection to local balances and transactions that make the reclassification understandable.
For Almvik, the controller first shows the cost in its old position, then the movement, and finally the new position. The CFO can explain the reporting change without presenting it as a saving or a cost increase.
Decide how comparative figures should appear
Two approaches are particularly useful for internal management reporting. The choice depends on the purpose and on how reliably historical figures can be recalculated.
Show historical figures using the new definition
This makes periods easier to compare when the same mapping can be applied to a controlled historical dataset. Label the comparative figures as restated for management reporting. Preserve the previously distributed report so recipients can understand why the figures differ from the earlier board pack.
Do not apply new mapping retrospectively just because the system permits it. An account may previously have contained something different. Acquisitions, changes to the chart of accounts or incomplete dimensions can make the same rule misleading for earlier periods. Test whether the definition actually fits the periods being compared.
Keep previously reported figures and explain the difference
This is an option when historical figures cannot be recalculated reliably, or when recipients need to follow the original reporting delivery. Explain the definition change separately and make clear that the line is not directly comparable between periods.
The drawback is that readers have more work to do. Help them with a short bridge and distinguish reported movements from movements on a comparable basis. Do not provide a precise effect calculation if the evidence only supports a qualitative explanation.
Document the decision alongside the report
A colleague who was not involved should be able to understand the change note. It does not need to be long. Use these fields:
- Definition: What does the report line include after the change?
- Scope: Which entities, accounts, dimensions and periods are affected?
- Basis: Which data extract and currency assumptions were used?
- Effect: Which report lines and subtotals change or remain unchanged?
- History: Have comparative figures been restated, or retained with an explanation?
- Ownership: Who checked the calculation and approved the definition?
Keep the note with the report version based on that decision. A chat message may explain the intention, but it is of little help if its connection to the actual reporting run disappears. Retain both the previous reporting basis and the documentation of the new calculation.
Test the next reporting period too
A mapping change is not fully checked just because one historical run reconciles. See how the rule behaves when a new period arrives. Check that new accounts are classified correctly, local corrections are handled and internal transactions are still treated consistently before elimination.
Ask a colleague to explain the difference using the change note and report evidence. If the explanation depends on the author’s memory, the documentation is still too weak. The aim is not more text, but a repeatable assessment.
You can perform this test in Excel if the model is understandable, access and versions are controlled, and the finance team can follow the calculation. Entity count alone is not a reason to switch tools. The need becomes clearer when changes must be maintained in several places, or when the connection between the report and its evidence repeatedly has to be rebuilt manually.
Make definitions part of group financial control
Good group reporting also preserves the meaning of figures when the structure changes. Data collection, mapping and the finance team’s judgement are different parts of the work. Read more in from system integration to an explainable group number.
Sumledger brings financial controlling, group reporting and consolidation together across existing accounting systems. When evaluating it, bring a specific mapping change and examine how the report line can be traced to accounts, transactions and available voucher evidence. Also agree how your historical figures and report versions should be managed; do not assume an integration alone resolves this.
Want to see how a shared control layer could support this work? Book a short demo, starting with the report you actually need to explain.
Relevant to explore
Group reporting
Unify reporting and consolidation for growing groups across companies and systems.
Financial control
Start at group level and drill down to company, account, transaction and voucher where data is available.
Multi-ERP control
Give finance one shared control layer even when subsidiaries use different ERP and accounting systems.
Shared reporting
Work from a shared reporting basis across your companies. Data is imported every hour so CFOs and controllers can follow performance and investigate variances.
See how the group figure can be explained
Start with a specific report line and see how Sumledger can bring group financial control together across systems.
Book a short demoRead next
Related articles

Group finance reporting: 8 checks before sign-off
A practical CFO and controller sign-off: eight checks that make group numbers comparable, traceable and explainable.
From system integration to an explainable group number
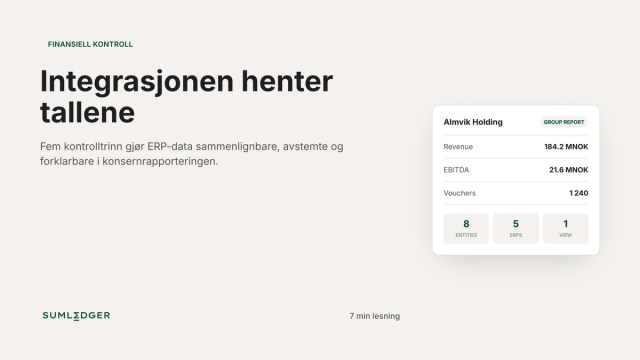
Five control steps that make ERP data comparable, reconciled and explainable in group reporting.