
Product
Why Multi-ERP Groups Struggle With Reporting (And How to Fix It)
Sumledger
A practical approach to account mapping, intercompany entries and variance analysis across different accounting systems.

Multiple ERP systems are not necessarily a problem. The difficulty begins when finance must rebuild a shared group view every month from separate exports, account structures and reporting definitions.
Why local reports do not automatically add up
Two subsidiaries can record similar costs in different accounts or use different dimensions. Adding their exports does not make the result comparable. Finance needs agreed definitions, mapping and checks on the reporting period.
Start with the data each system can provide
List the systems in use and confirm the available connections and data coverage. Check which accounts, dimensions, transactions and supporting documents can be retrieved. Do not assume that every ERP exposes the same detail or refresh frequency.
Own the group reporting logic
Map entity accounts into a shared structure. Define how intercompany entries will be identified, review differences and validate KPI formulas. Assign an owner for changes to mappings and reporting rules.
Make the report explainable
Compare results by entity, account and dimension. Investigate underlying transactions, vouchers and attachments where available. Retain review steps for gaps in source data rather than treating data retrieval as a completed control.
Where Sumledger fits
Sumledger connects supported accounting systems and gives CFOs and controllers a shared layer for group reporting, consolidation, eliminations and analysis. Excel can remain part of the workflow. Confirm fit against your systems and reporting needs.
Relevant to explore
Multi-ERP control
Give finance one shared control layer even when subsidiaries use different ERP and accounting systems.
Group reporting
Unify reporting and consolidation for growing groups across companies and systems.
Financial control
Start at group level and drill down to company, account, transaction and voucher where data is available.
Explore group reporting for your group
See how a shared reporting layer can support your entities, accounting systems and month-end controls.
Explore group reportingRead next
Related articles

How to Build a Scalable Reporting Stack for Growing Groups
Build a reporting foundation around source data, shared account mapping, controlled eliminations and clear ownership as the group grows.
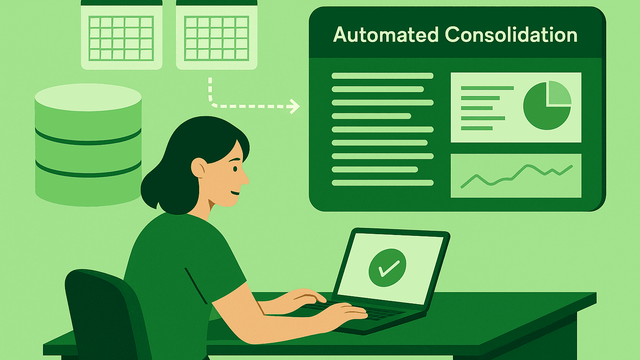
Excel vs. Consolidation Software: When Is It Time to Switch?
Use control, complexity and reporting effort to decide when Excel is sufficient and when a shared group reporting layer becomes useful.
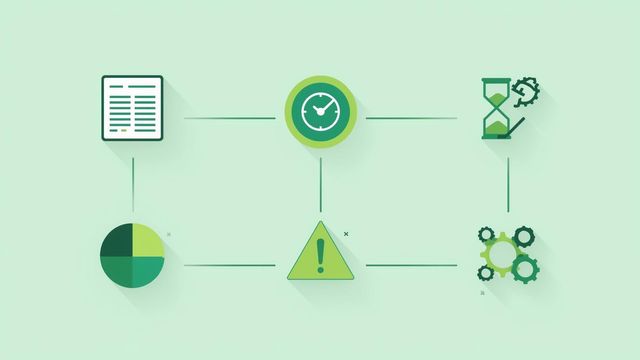
The True Cost of Manual Group Reporting (And Why Automation Pays Off)
Manual group reporting looks simple on the surface, but the hidden costs are significant. Time-consuming exports, manual mappings, currency errors and dependency on key individuals slow down the entire finance function. Automated consolidation removes this friction by standardising data, updating numbers in real time and eliminating manual work while Sumledger still provides full Excel flexibility through Sumledger EXL. The result is faster reporting, fewer errors and more time for meaningful analysis.